Methods for plotting sftrack/sftraj
Methods for plotting sftrack/sftraj
# S3 method for sftrack
plot(x, y, key.pos, key.width, ...)

# S3 method for sftraj
plot(x, y, key.pos, key.width, ..., mode)
Arguments
| x | 'sftrack' or 'sftraj' object |
|---|---|
| y | ignored |
| key.pos | Integer; side to plot a color key: 1 bottom, 2 left,
3 top, 4 right; set to NULL to omit key, or -1 to select
automatically (defaults to 4; see |
| key.width | Amount of space reserved for the key, including
labels (see |
| ... | Further arguments passed to 'plot.sf'. Among others, arguments for the key are set differently in 'sftrack' to allow for longer labels by default (but can be nevertheless adjusted). |
| mode | Character; either of |
Details
Plotting mode refers to considering the trajectory as
connected elements. For "steps+points", this means it
will plot each step & point individually. The alternative,
faster "steps" mode merges connected steps into
multilinestrings, which are plotted as continuous lines. This
approach is much faster to plot with large objects, and is thus
turned automatically on when n(steps)>10,000. Finally,
"trajectories" merges the full trajectory as a continuous
line (i.e. ignores gaps).
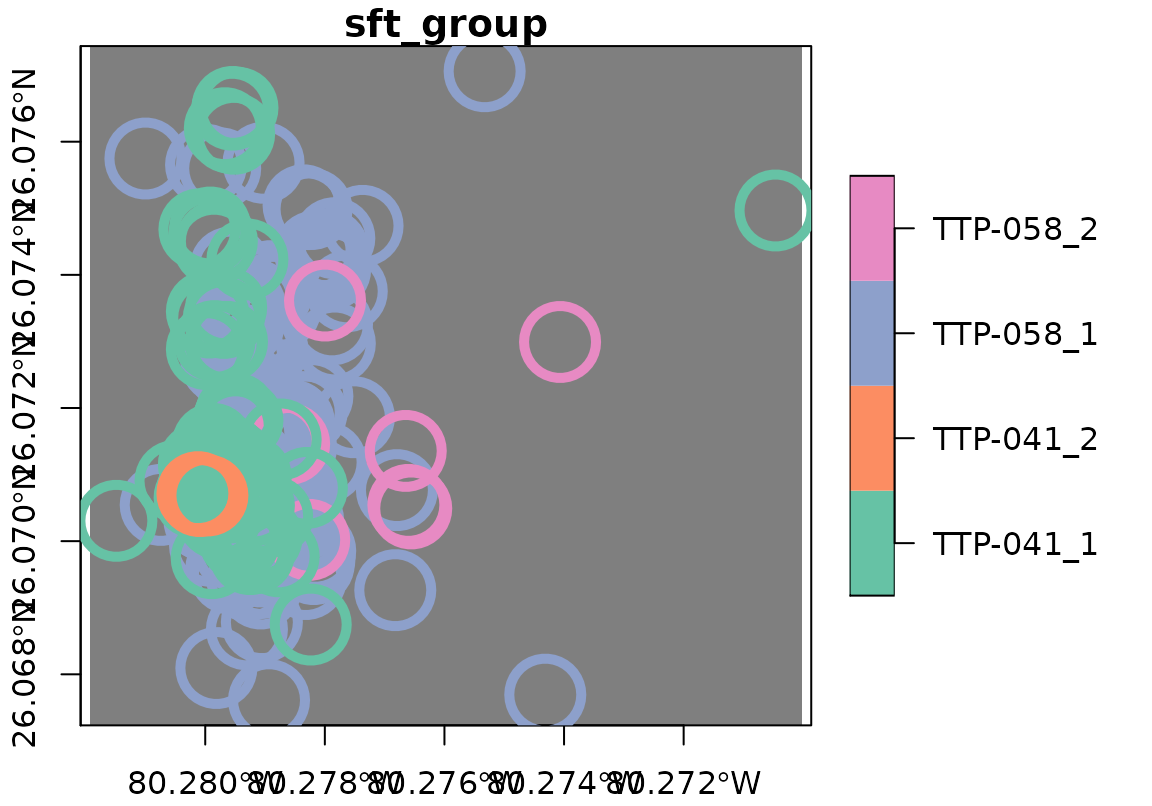
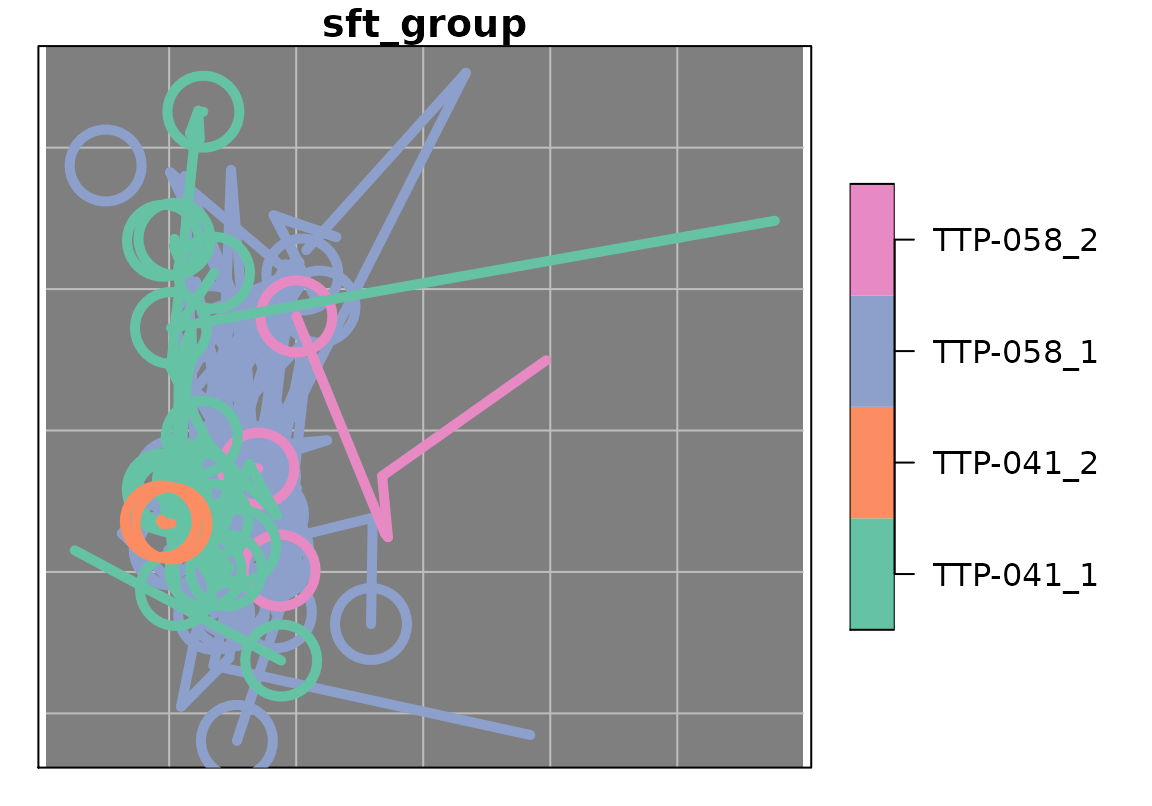
Examples
## Plotting with sftrack is just like sf. `...` will accept most ## arguments as 'plot.sf': plot(racc_track, axes = TRUE, lwd = 5, cex = 5, bgc = "gray50")## sftraj will as well for the most part; however it is a more complex ## structure that combines points and steps (in step mode): plot(racc_traj, lwd = 5, cex = 5, bgc = "gray50", graticule = TRUE)