Methods for plotting sftrack/sftraj
Methods for plotting sftrack/sftraj
Arguments
- x
'sftrack' or 'sftraj' object
- y
ignored
- key.pos
Integer; side to plot a color key: 1 bottom, 2 left, 3 top, 4 right; set to NULL to omit key, or -1 to select automatically (defaults to 4; see
plot_sffor more details).- key.width
Amount of space reserved for the key, including labels (see
plot_sffor more details).)- ...
Further arguments passed to 'plot.sf'. Among others, arguments for the key are set differently in 'sftrack' to allow for longer labels by default (but can be nevertheless adjusted).
- step_mode
Logical; whether to plot in step mode, see details, defaults to TRUE, unless there are more than 10,000 steps.
Details
Step mode refers to considering the trajectory as individual 'steps', in the case of plot this means it will plot each line & point individually. This approach is much slower to plot with large objects, and is thus turned off when n(steps)>10,000. The alternative, much faster method is to merge the steps into a multilinestring as continuous lines.
Examples
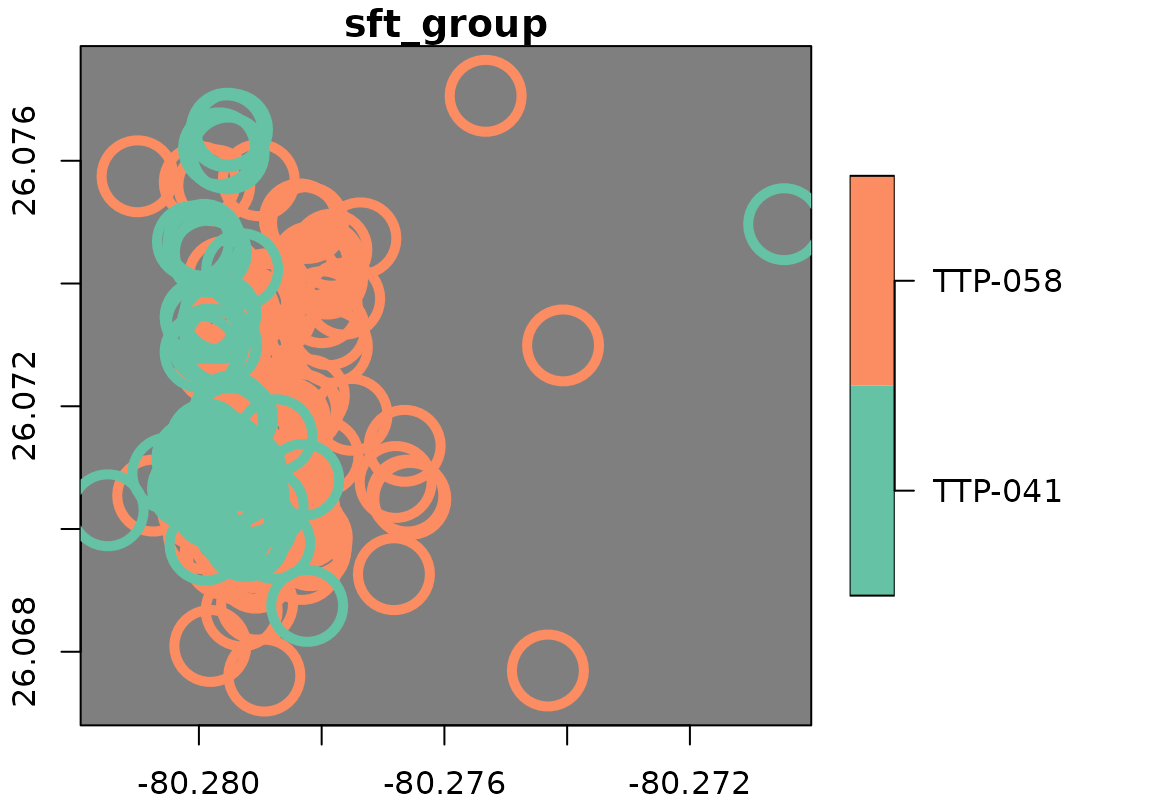
## Prepare an 'sftrack' object:
data("raccoon")
raccoon$timestamp <- as.POSIXct(raccoon$timestamp, "EST")
burstz <- c(id = "animal_id")
my_sftrack <- as_sftrack(raccoon,
  time = "timestamp",
  coords = c("longitude", "latitude"),
  group = burstz
)

## Plotting with sftrack is just like sf. `...` will accept most
## arguments as 'plot.sf':
plot(my_sftrack, axes = TRUE, lwd = 5, cex = 5, bgc = "gray50")


## sftraj will as well for the most part; however it is a more complex
## structure that combines points and steps (in step mode):
my_sftraj <- as_sftraj(raccoon,
  time = "timestamp",
  coords = c("longitude", "latitude"),
  group = burstz
)
plot(my_sftraj, lwd = 5, cex = 5, bgc = "gray50", graticule = TRUE)
## sftraj will as well for the most part; however it is a more complex
## structure that combines points and steps (in step mode):
my_sftraj <- as_sftraj(raccoon,
time = "timestamp",
coords = c("longitude", "latitude"),
group = burstz
)
plot(my_sftraj, lwd = 5, cex = 5, bgc = "gray50", graticule = TRUE)
