Note: This is the Multimedia Supporting Information for the manuscript “Joint seasonality in geographic and ecological spaces, illustrated with a partially migratory bird”, from Basille et al., available as a preprint here.
In this animation (available as
Video_S1.gif,
Video_S1.mp4, and
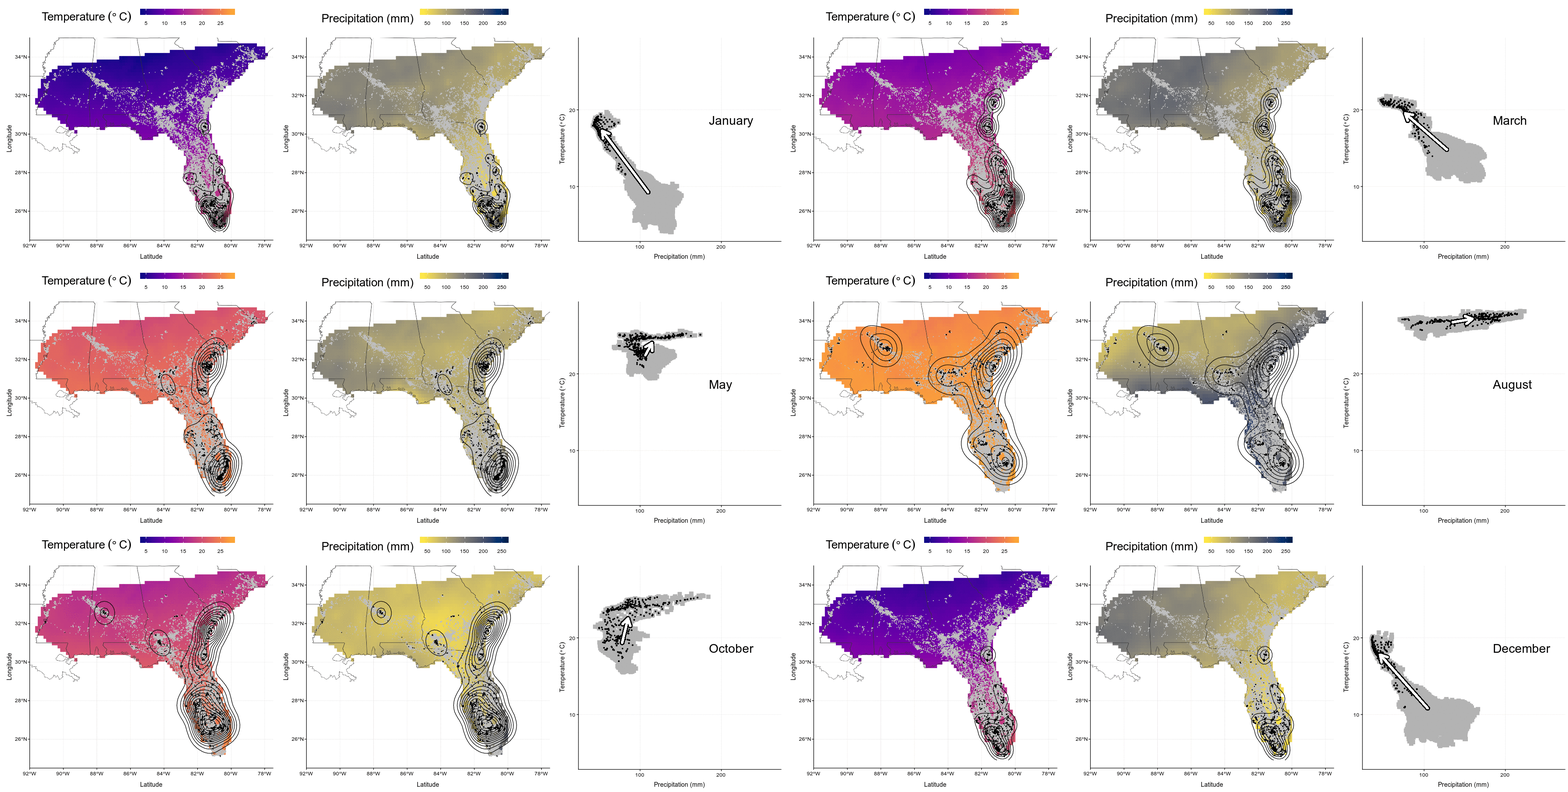
Video_S1.mov), each panel presents
wood stork monthly ranges (left and center) and climatic niche (right)
during the year. Range maps show current GPS locations in a given
month in black with kernel contour lines, and all locations from the
entire dataset shown as a reference in gray, on a background of
temperature (left, from blue for colder temperatures to red for warmer
temperatures) or precipitations (center, from yellow for dry
conditions to blue for wet conditions). Climatic niches show current
conditions used in a given month (precipitation on the X-axis, and
temperature on the Y-axis) in black, in comparison to conditions
available in the study area in a given month in gray. The marginality
arrow defines the difference between average available conditions and
average used conditions.
 Wood Stork seasonality